How to create WordPress charts and graphs with a plugin

Creating charts graphs in WordPress is the best way to visually represent data and make it more engaging for your users, and WP Table Manager offers the best tool to do this with awesome themes and in a few clicks.
WP Table Manage is a really powerful plugin that allows us to create tables and show them in the frontend, there is an option to style them and show these as tables but we can also get the data in our table and convert it directly into a graph or chart.
In this post, we will learn how to create these Charts and Graphs.
Table of content
Looking for a robust table management solution for client websites?
From pricing tables to product comparisons, this plugin offers powerful features to present
data in a clear and
user-friendly manner.
Get the competitive edge now!
Select the WordPress table
First of all, we will need to create or select our WP Table.
In order to do this, go to WP Table Manager > All tables
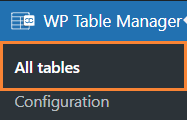
On this page, we can create a table or select an existing one.
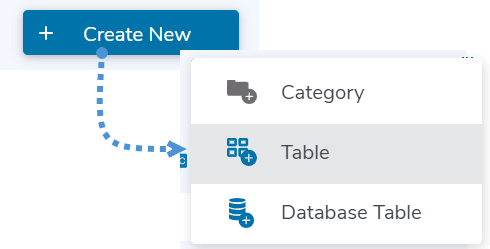
To create the table, we only need to click on +Create New > Table or Database Table depending on if we want to generate data directly from the database.
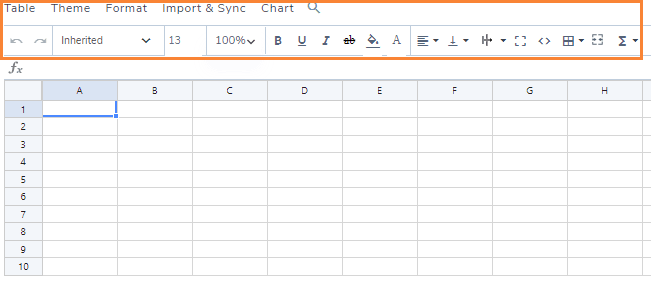
We will have available our table editor full of tools to add data to our table, including options like import from an excel file, OneDrive Excel, a CSV file, or Google Sheets, as well as an auto sync if we want to edit our files externally from the WordPress site.
It is also important to note that we can use an already created table.
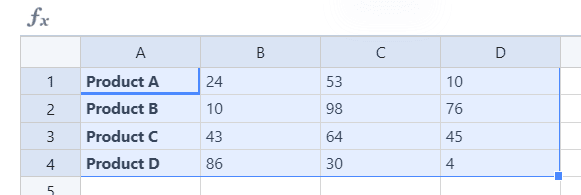
Now we can start filling our table with data to generate the charts and graphs directly from there.
Generating fully customizable charts and graphs
Now that we have our table created, is time to generate our charts and graphs!
In this example, we will use a very simple table with data but if it has data that can be converted, it will work perfectly.
In the table, select the rows that will be used for the chart or graph.
Now click on Chart > Create Chart from data.
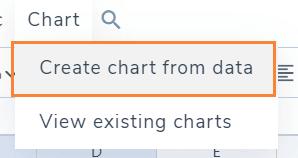
A graphic will be displayed with the data that was selected in the table with many option to the right to fully customize it.
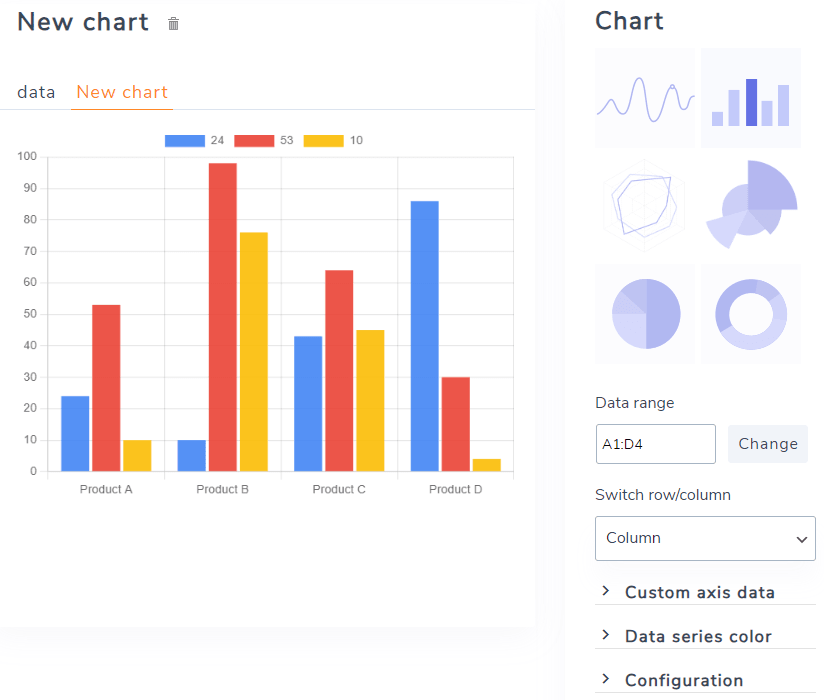
As we can see in the right panel, we have many options, let's check them one by one!
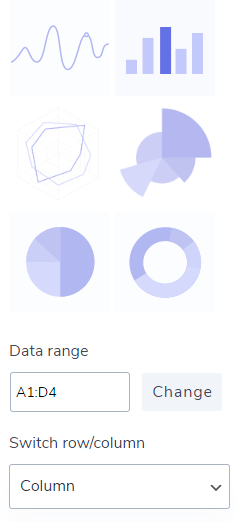
Themes: The first option that we can find, we can select here between charts and Graphs with a different preview of the theme available, there is also an option to manually change the data range and also select if we want to use Rows or columns as the data.
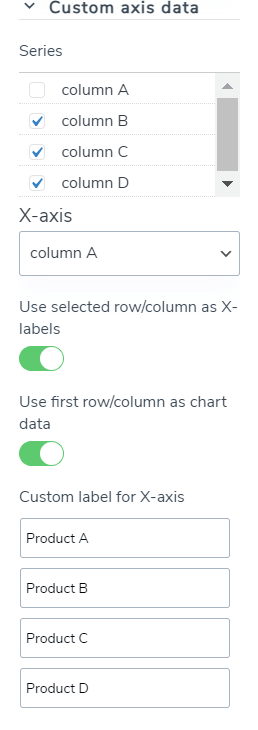
Custom axis data: On this section we can select the x/y axis as well as set labels for our charts/graphs and if we want to use the first row/column as y/x labels and data.
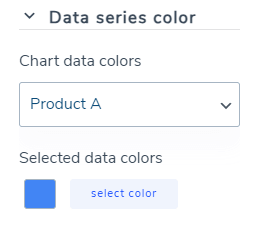
Data series color: On this section, we can select the color that will be used for each data.
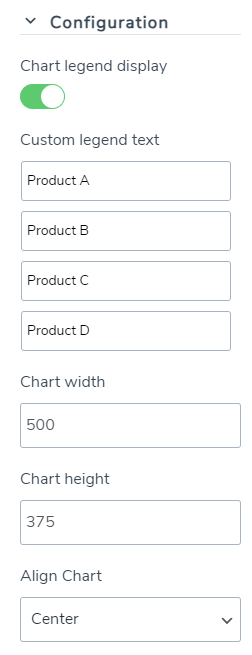
Configuration: On this section we have the option we can select if we want to hide the legend, edit the legend content as well as edit the chart width, height and the alignment.
Easy to use tools and fully customizable charts as we can see!
One click themes for your charts and graphs
Now that we have our chart fully created and customized, is time to select the theme that fits our site and chart so let's check the available themes!
Perfect for simple data.
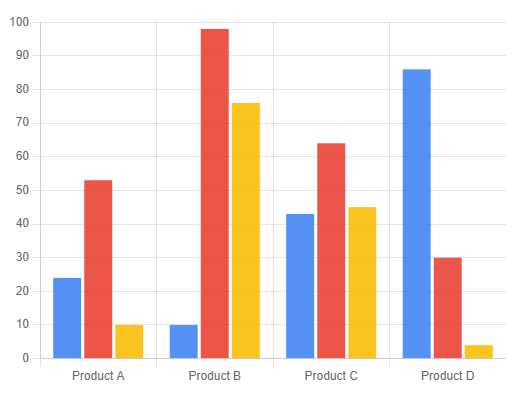
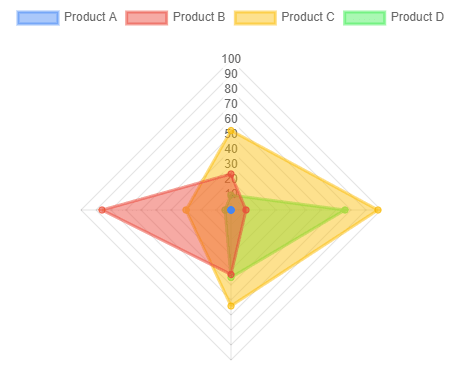
A perfect theme to compare different products or items.

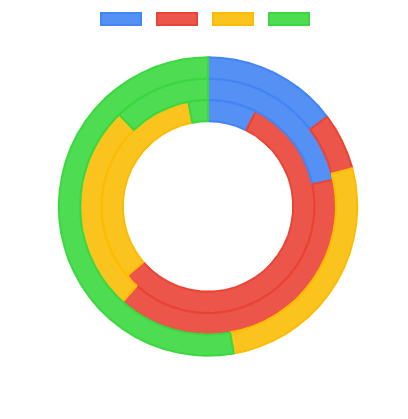
This theme is perfect for checking the items with percentages-based graphics.
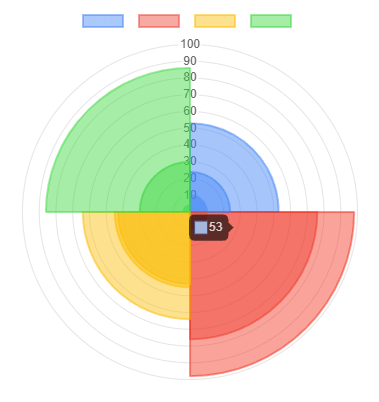
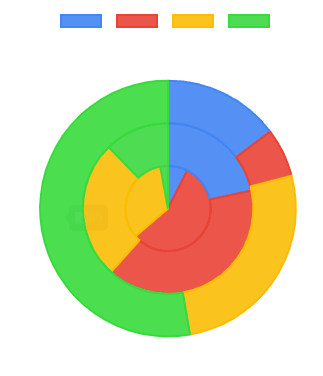
A statistics themes.
And finishing with 2 circular percentage themes that will work pretty well and perfectly fit all pages!
First:
Second:
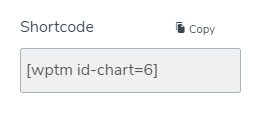
Perfect themes that just fits any type of site and any type of data! And when we are done, all we need to dois use one of the specialized blocks/widgets available for all major page builders or the shortcode found at the right panel to make it work on all the editor available for WordPress!
Calling all webmasters!
Enhance your client websites with WP Table Manager. Easily manage and customize tables, charts,
and spreadsheets,
providing clients with dynamic and engaging data visualizations.
Upgrade your web design services today!
Tables, Charts, Graphs, cloud connection and more!
Using this awesome plugin will allow us not just to create charts and Graphs with all the customization tools but we will be able as well to generate tables from the database, the cloud, and files as well as create complex tables with formulas and add them to our content with easy-to-use tools!
What are you waiting for? Go here and get your own subscription!
When you subscribe to the blog, we will send you an e-mail when there are new updates on the site so you wouldn't miss them.


Comments